Until today, information has never traveled so fast. What is surprising is not only its speed, but also its quantity, complexity and value. Nowadays, almost all of us generate valuable information in our daily lives, and companies are no different.
The question is: This information is just being generated without being valued or is it being used to make a difference?
The relationship between data and organizations
Data is of fundamental importance to organizations today. It allows them to make data-driven decisions, enabling businesses to generate real-time and up-to-date insights and predictions to optimize their performance and potential. Through data analysis, it is possible to make informed business decisions in order to achieve sustainable growth, with less risk and more certainty.
According to NewVantage Partners 98% of executives indicate that their organization aspires to a data-driven culture, but only 32.4% report having success. Although it can be challenging to implement this kind of culture at first, the effort may prove to be worthwhile.
Finds from a 2022 survey by NewVantage Partners, indicate that companies that are investing in data initiatives are getting results.
“97.0% of participating organizations are investing in Data initiatives and 92.1% of them are realizing measurable business benefits.”
Data and AI Leadership Executive 2022 Survey
Data-Driven Decision-Making: What is it and what is it used for?
The process of using facts, metrics, and data to inform and guide the decision making process, goals, and objectives of the organization is called Data-Driven Decision-Making (DDDM).
The purpose of this process is to validate strategic actions providing less risk, more certainty and therefore more security.
Data Driven Decision Making best friend
What is it?
One of the tools that can help in this DDDM process, is Power BI. It is a business analytics and intelligence tool provided by Microsoft. With this software, companies are able to analyze and visualize data that is then transformed into valuable insights in order to turn data into action.
Why use it?
As we have been discussing, data has many benefits. Thus Power BI allows to collect and organize data from different sources within the organization and build interactive dashboards, charts and business intelligence reports with valuable insights to help companies make DDDM.
In other words, Power BI allows companies to make data easier to understand and get more out of the information at their disposal.
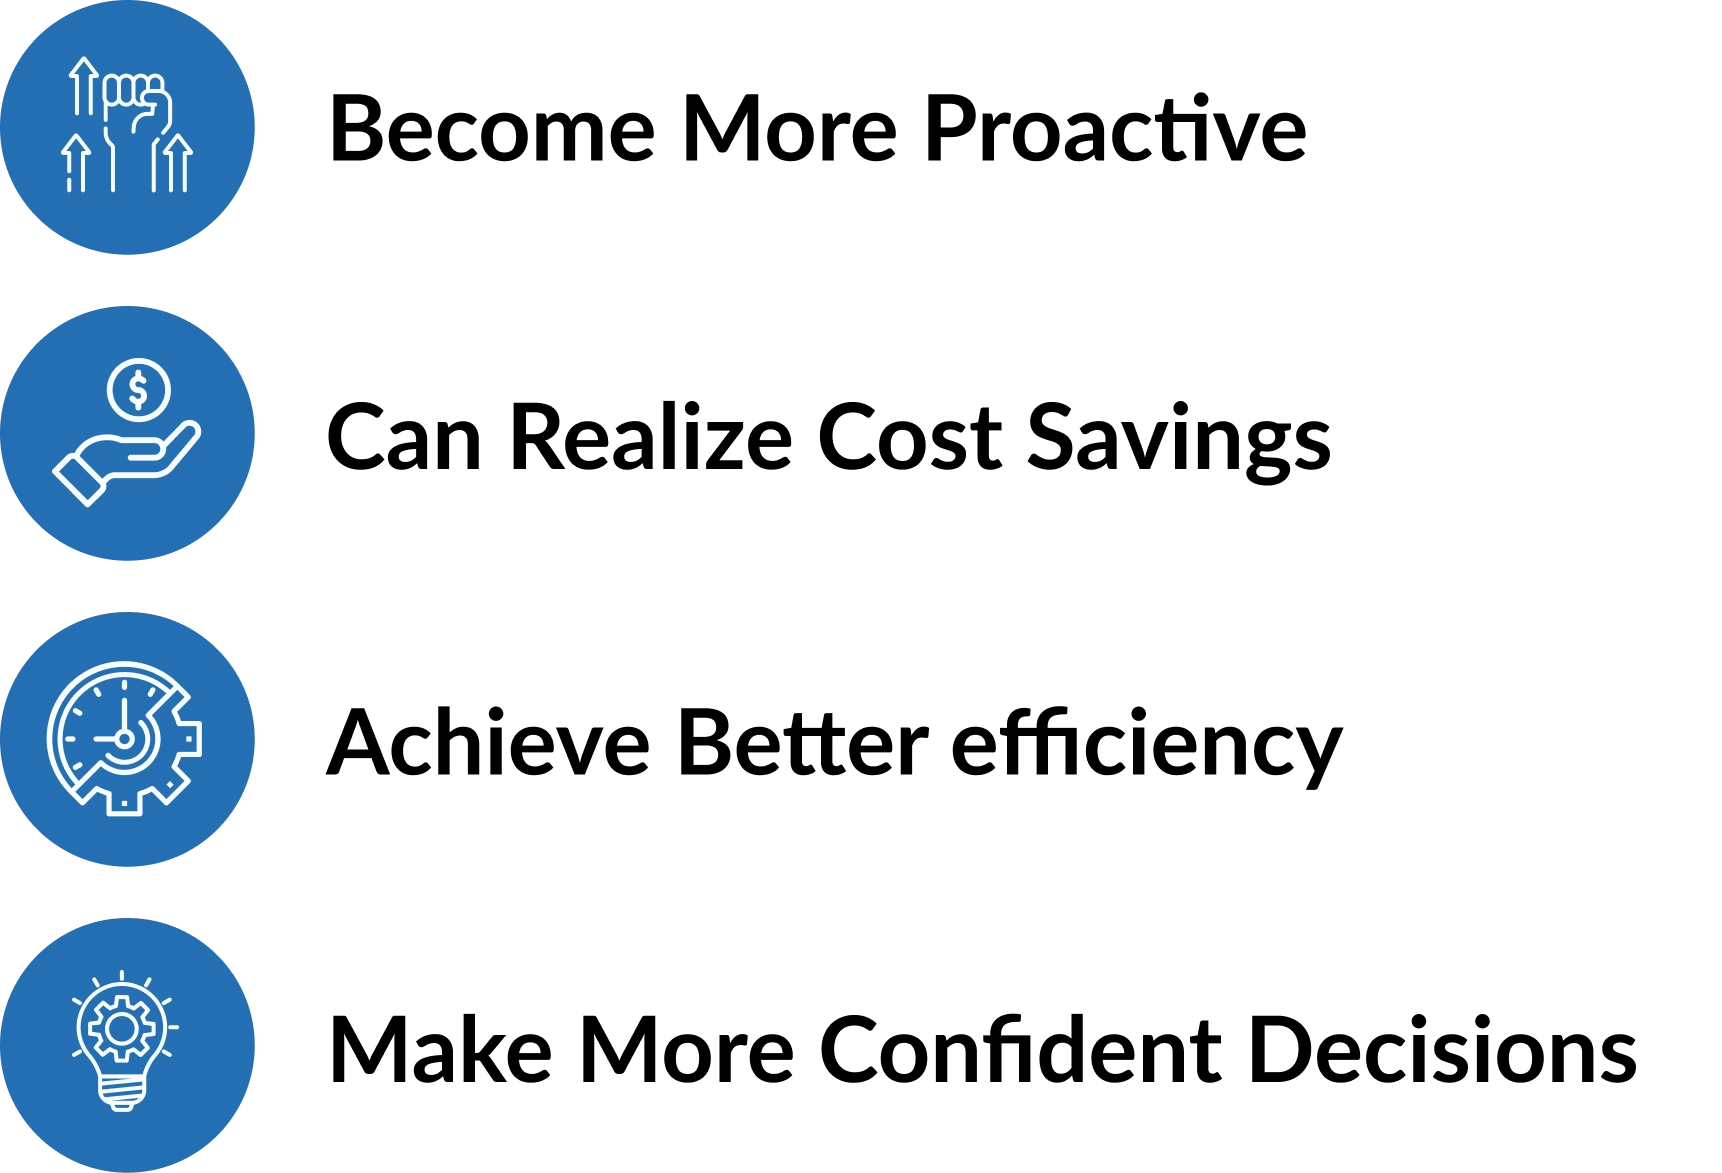
- Create amazing data experiences
- Gain insight from all your data sources
- Empower everyone and make decisions with confidence
This tool can be used to manage all facets of a company. For example logistics, customer analysis, sales, market analysis, financial, and also manufacturing processes.
Data in the industry
With the emergence of Industry 4.0, organizations dependence on data has increased. Manufacturers are integrating new technologies such as Internet of Things (IoT) and software tool to enhance a more connected manufacturing environment into their production facilities.
To all these new Industry 4.0 technologies operate they need data. In other words, we are talking about the importance of Industry 4.0 data.
What is Industry 4.0 data?

In order to all these computer systems to interpret the physical world around them and communicate among them, they need data. Without data it would be impossible the concept of “Industry 4.0” to exist, because data is the new way of communicating.
These way, data-driven manufacturing companies use various sources of data to gain insights. Later, this insights help creating new solutions to improve manufacturing processes.
However, Revolution 4.0 and the importance of data doesn’t only apply to systems and machines, but also to workers within the manufacturing industries.
Connected Worker
This is where the term “Connected Worker” comes in. They are integrated with their work environment through connective technologies that also exchange data with other devices and machines in a linked work system.
These connected technologies help them do their jobs more efficiently and safely, augmenting their capabilities.

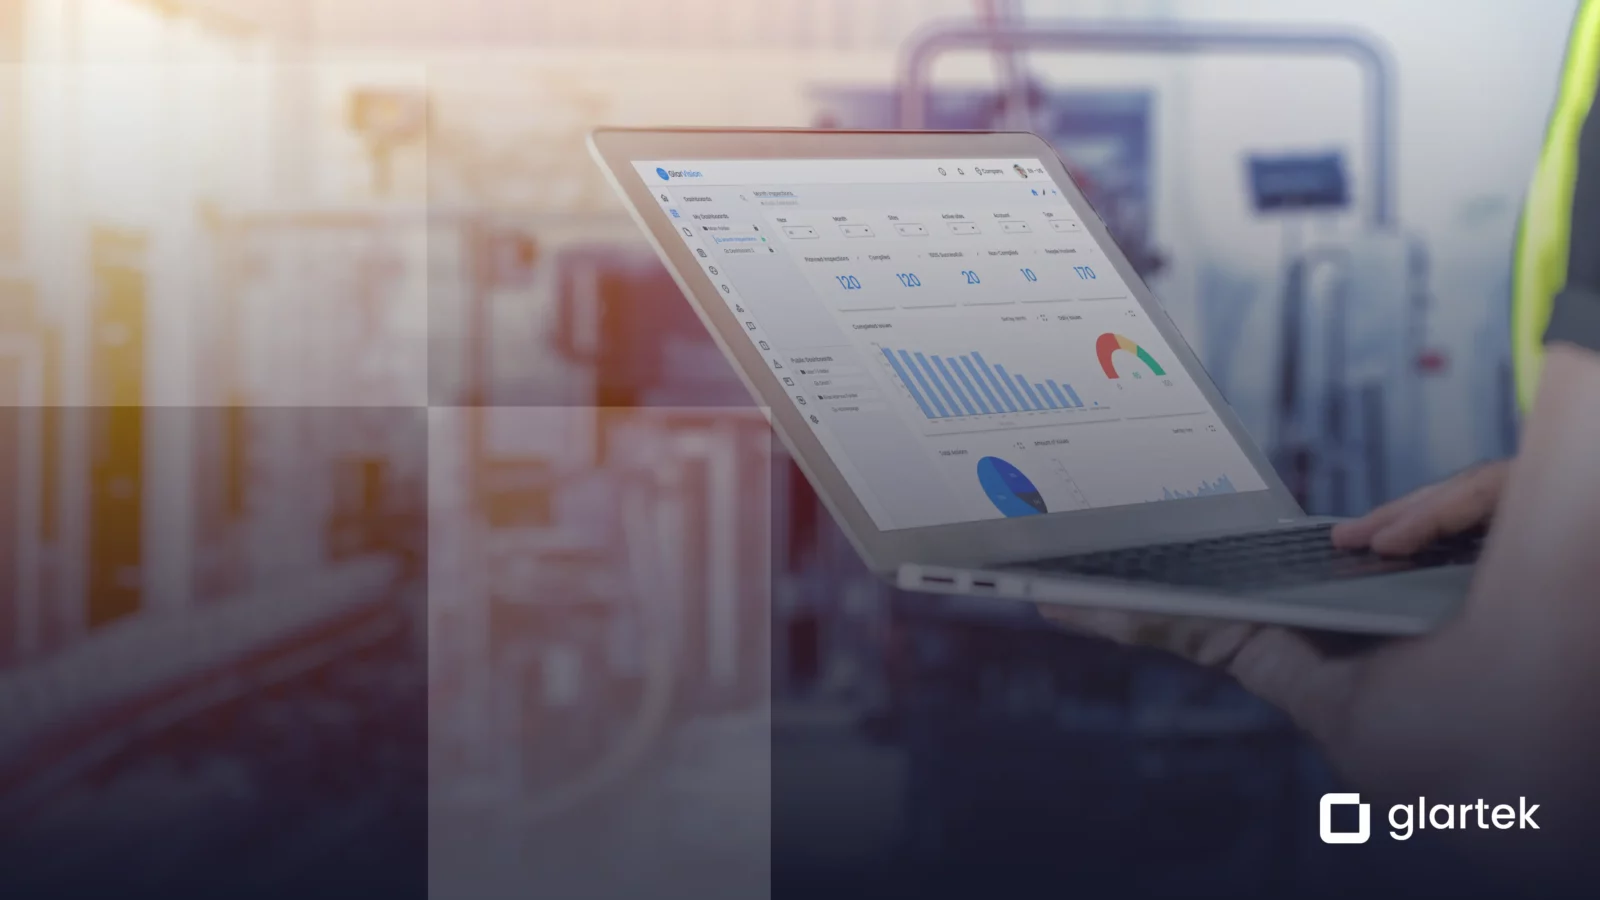
The Augmented & Connected Worker platform
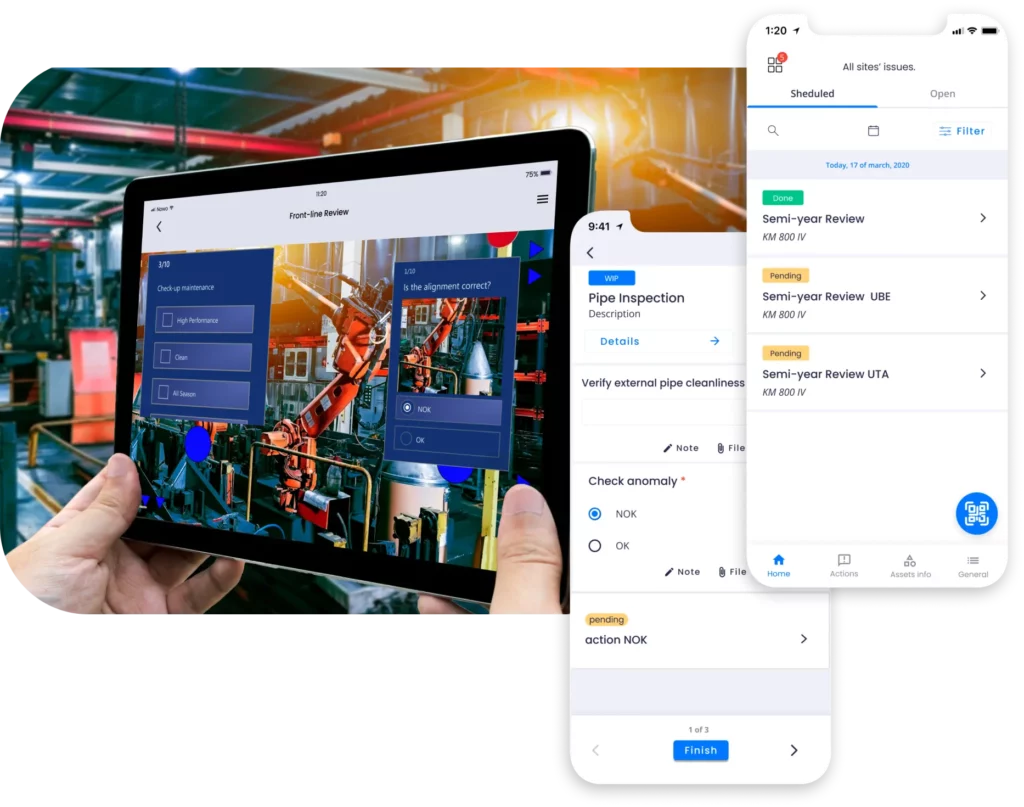
Our platform does exactly what we have been discussing, enables a connected workforce to ensure a more efficient, safer and faster way to achieve work excellence. It transforms digital processes data into valuable outputs to guide front-line workers and provide them with new mobility with 2D or Augmented Reality (AR) guidance, and visual remote support for operations.
The Augmented & Connected Worker Platform integration with Power BI
With so many data sources, Power BI can be an allie due to the possibility of being integrated with an organization’s existing business environment. Helps you connect various data sources and transform them into clear visualizations of data.
Data from The Augmented & Connected Worker is not different. It’s is possible to build your own Augmented & Connected platform by integrating with Power BI or others in-house native apps.
Augmented & Connected Worker makes it possible to monitor, create customized reports and have access to analytics all in one place. It can help optimize various industrial procedures, like 5S Audits, changeovers or LOTO.
- Monitoring operations and compare different factories or sites
– Monitoring tasks, operations, and teams from different sites and factories - Improve your team management
– Know what your team planned and were the procedures are taking place
– How each team member operates, their struggles and performances - Decide the best continuous improvement strategy
– Understand how tasks are being performed
– How many times an operation was executed
– How many tasks per procedure failed and succeeded
Therefore, our platform can be one of the sources of Power BI and the data generated can be exported and analyzed by this analytical tool.
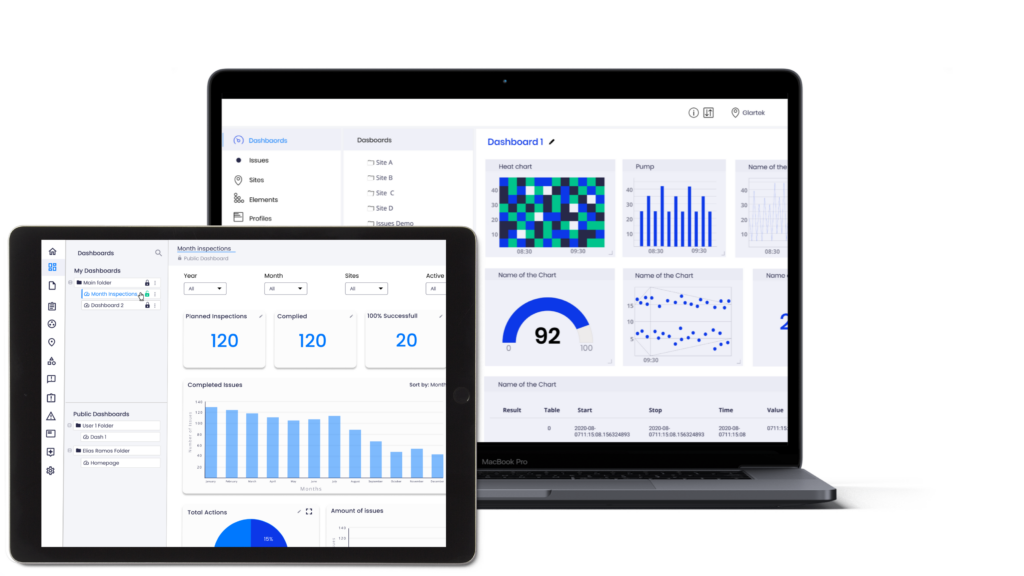
Although The Augmented & Connected Worker has the option to create dashboards, the integration with Power BI can be a valuable complement to the platform. It allows you to create some graphics that currently are not supported in our solution. Here are some examples:
- Wait time between issue trigger and execution
- Number of actions made over time by workers
- Distribution of execution time per procedure
- Distribution of execution time per person
In Conclusion
Power BI is a powerful business intelligence tool that has been conquering and changing the world of data visualisation. When integrated with Augmented and Connected worker can take your organization to new levels of efficiency, results and continuously improvement. It’s time for you to be part of this new reality!
Learn More
Interested in learning more about digital solutions and how they are changing shop floors? Explore our use cases or reach out to our team to schedule a free demonstration to understand the full potential of Glartek’s Augmented & Connected Platform.